Calibration parameters (校正參數) for drawing an SVG file Back
Here what I wrote is all about recording the calculation of the calibration parameters when drawing a SVG file. Before that, you're supposed to know how to draw a SVG file with canvas in JavaScript.
Why need calibration parameters?
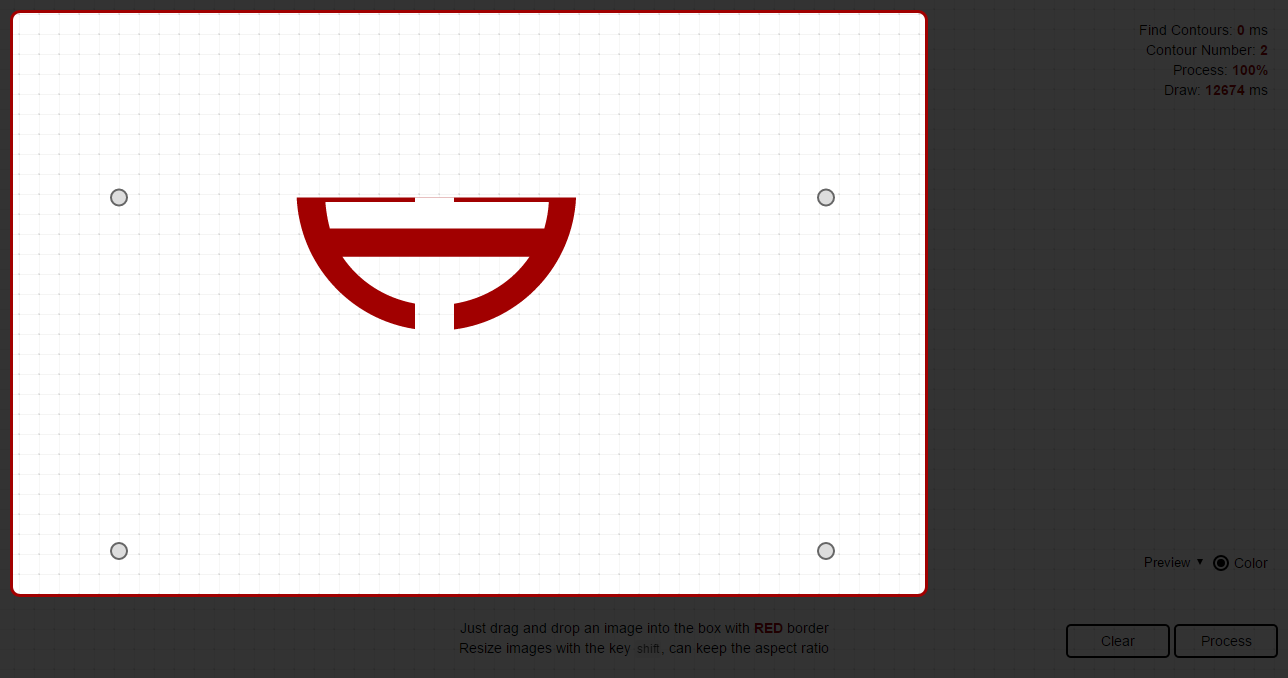
In the last step of drawing, we will find that there exists a problem. As shown below, there is a canvas area, which I call a panel.
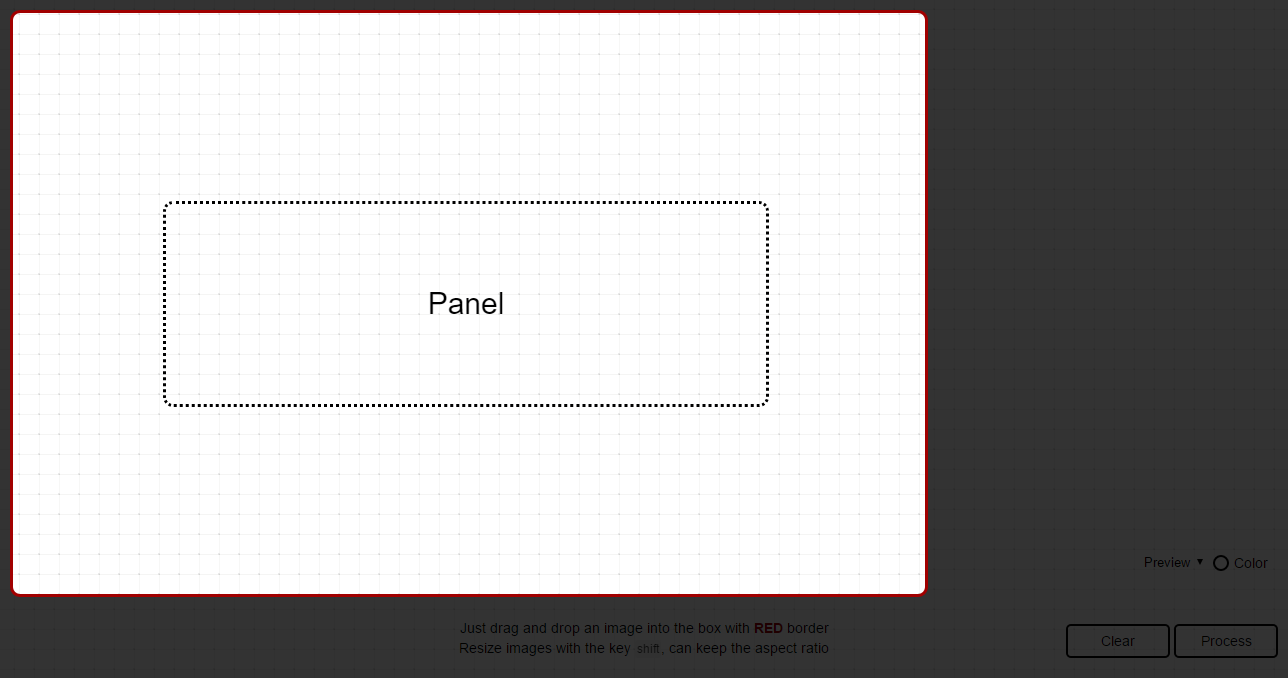
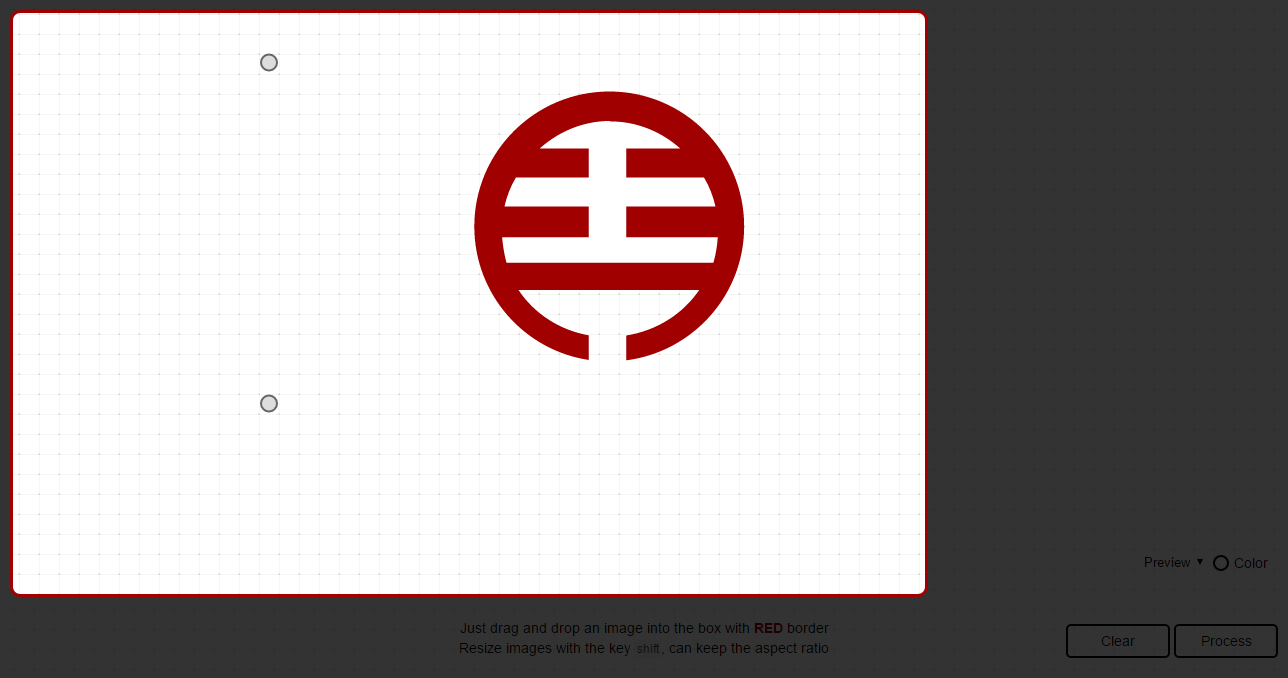
When I drop a SVG file into this panel, and start to draw it,

I find that only data of points is not enough, because the data should always depend on some attributes of a SVG element, including width, height, and viewBox. Besides, what if I can drag and resize this SVG like below:

As I change the size of this SVG, data of points in paths won't change at the same time. What that means is that what I have drawn should be always in the same position.
Attributes like width, height, and viewBox of this SVG element will also affect data of points like dragging.
<svg xmlns="http://www.w3.org/2000/svg" width="400" height="200" viewBox="0 0 200 200">
    <!-- paths -->
</svg>
That's why I need a calibration parameter for updating data of points in paths.
Calculation
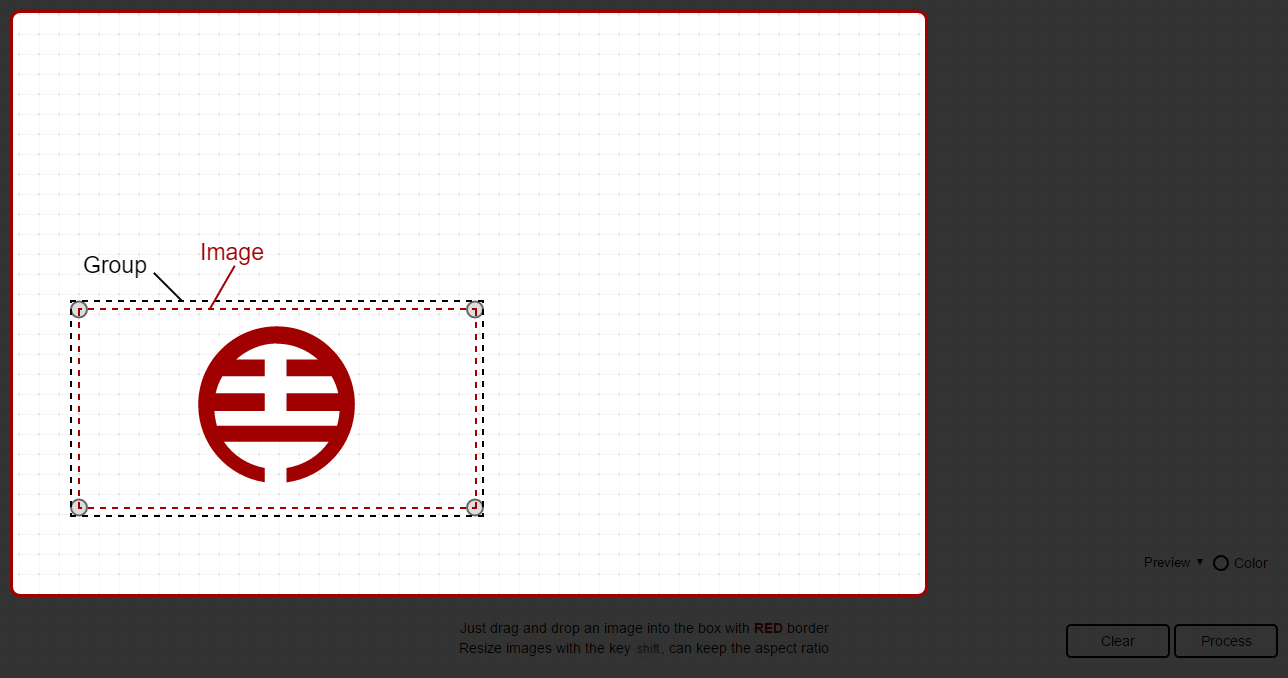
So I have defined some parameters: dx, dy, ratioX, and ratioY. Before calculation, there are some aspects needed to be explained.
- Group: a group for storing image and 4 respective circles, which is used for dragging to resize
- Image: the image stored in a group
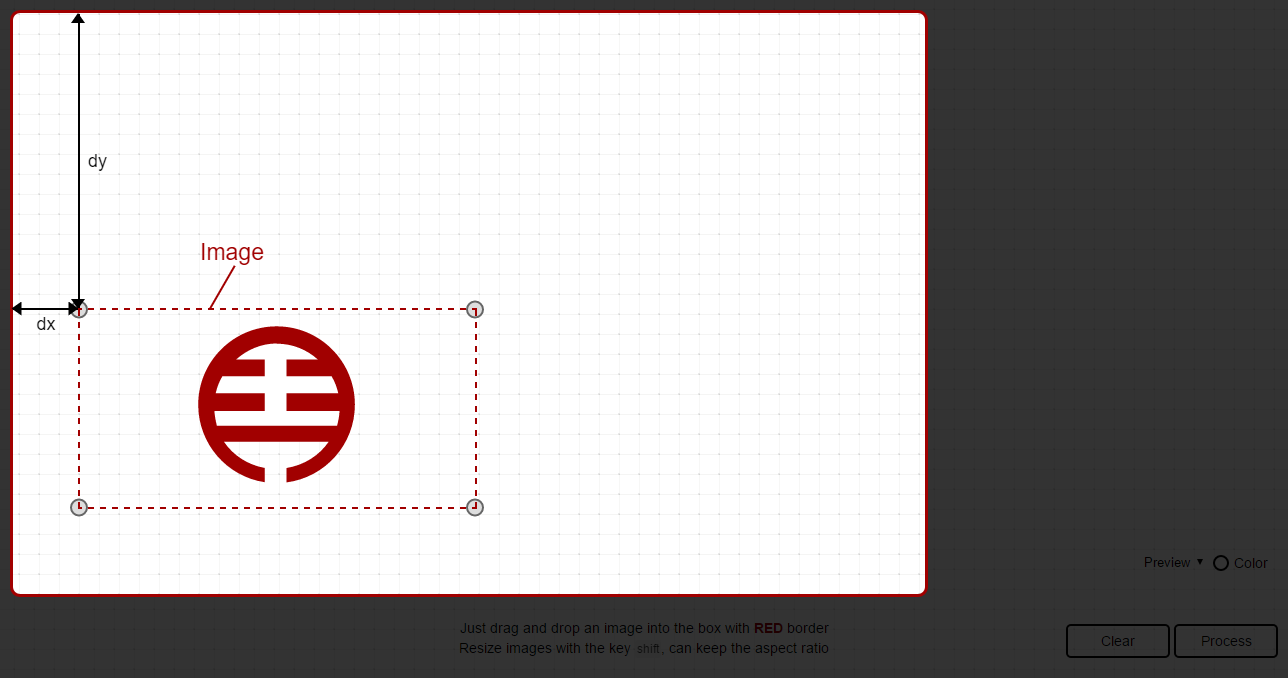
Positions
(dx,dy) represent the current position of that image.
- oriX: the original
xvalue of the image - oriY: the original
yvalue of the image - moveX: difference of the
xvalue. - moveY: difference of the
yvalue. - viewBoxX: the
xvalue of the attributeviewBoxof that image - viewBoxY: the
yvalue of the attributeviewBoxof that image
var dx = image.oriX + image.moveX;
var dy = image.oriY + image.moveY;
Ratio
Ratio is affected by some factors, and the calibrationParam is calculated as below:
- oriW: the original width of the image
- oriH: the original height of the image
- svgW: the width of the SVG element
- svgH: the height of the SVG element
- viewBoxW: the width of the attribute
viewBoxin that SVG element - viewBoxH: the height of the attribute
viewBoxin that SVG element - curW: the current width of the image
- curH: the current height of the image
var calibrationParam = Math.max(image.oriW / image.svgW, image.oriH / image.svgH) * Math.min(image.svgW / image.viewBoxW, image.svgH / image.viewBoxH);

var ratioX = (image.curW / image.oriW) * calibrationParam;
var ratioY = (image.curH / image.oriH) * calibrationParam;
Note: remember that the x and y value of the attribute viewBox will also crop that SVG to show.
For this reason, we should fill data of points before drawing like this:
var pointsArr = [];
var pathLen = pathNodes.length;

for (var j = 0; j < pathLen; j++) {
    var index = pointsArr[].push([]);
    var pointsLen = pathNodes[j].getTotalLength();

    for (var k = 0; k < pointsLen; k++) {
        /** extract points from a path */
        var data = pathNodes[j].getPointAtLength(k);

        /** calculation of calibration parameters */
        var dx = image.oriX + image.moveX;
        var dy = image.oriY + image.moveY;

        var calibrationParam = Math.max(image.oriW / image.svgW, image.oriH / image.svgH) * Math.min(image.svgW / image.viewBoxW, image.svgH / image.viewBoxH);

        var ratioX = (image.curW / image.oriW) * calibrationParam;
        var ratioY = (image.curH / image.oriH) * calibrationParam;

        data.x = data.x * ratioX + dx - image.viewBoxX;
        data.y = data.y * ratioY + dy - image.viewBoxY;

        /** filter for cropping SVG */
        if (data.x >= dx &&
            data.x <= dx + image.curW &&
            data.y >= dy &&
            data.y <= dy + image.curH) {
            pointsArr[index].push(data);
        }
    }
}
Optimization
var pointsArr = [];
var pathLen = pathNodes.length;

for (var j = 0; j < pathLen; j++) {
    var index = pointsArr[].push([]);
    var pointsLen = pathNodes[j].getTotalLength();

    for (var k = 0; k < pointsLen; k++) {
        /** extract points from a path */
        var data = pathNodes[j].getPointAtLength(k);

        /** calculation of calibration parameters */
        var dx = image.oriX + image.moveX;
        var dy = image.oriY + image.moveY;

        var calibrationParam = Math.max(image.oriW / image.svgW, image.oriH / image.svgH) * Math.min(image.svgW / image.viewBoxW, image.svgH / image.viewBoxH);

        var ratioX = (image.curW / image.oriW) * calibrationParam;
        var ratioY = (image.curH / image.oriH) * calibrationParam;

        data.x = (data.x - image.viewBoxX) * ratioX + dx;
        data.y = (data.y - image.viewBoxY) * ratioY + dy;

        data.x = data.x >= dx && data.x <= dx + curW ? data.x : ((data.x < dx) ? dx : dx + curW);
        data.y = data.y >= dy && data.y <= dy + curH ? data.y : ((data.y < dy) ? dy : dy + curH);

        /** filter with edge */
        pointsArr[index].push(data);
    }
}
As the plugin is integrated with a code management system like GitLab or GitHub, you may have to auth with your account before leaving comments around this article.
Notice: This plugin has used Cookie to store your token with an expiration.